Orlando Magic vs Charlotte Hornets Match Player Stats: Paolo Banchero Leads Magic to Play-In Blowout
Play-in basketball is supposed to be tight, nerve-wracking, and decided by a handful of possessions. That’s not what happened at Kia Center. The Orlando Magic vs Charlotte Hornets match player stats from this game tell a one-sided story from the opening tip, as Orlando buried Charlotte by 31 points to punch a playoff ticket. If you came looking for the full box score breakdown, here’s exactly how the Magic dismantled the Hornets on their home floor.
The Lead
The Orlando Magic hosted the Charlotte Hornets on Friday, April 17, 2026, at Kia Center in Orlando, Florida, in the No. 8 seed game of the NBA Play-In Tournament. With a playoff spot on the line, Orlando never let the outcome feel in doubt, jumping out to a 38-16 first quarter and coasting to a 121-90 win. The victory sent the Magic into the first round of the playoffs for a third straight season, while it closed the book on Charlotte’s campaign and extended the Hornets’ postseason drought.
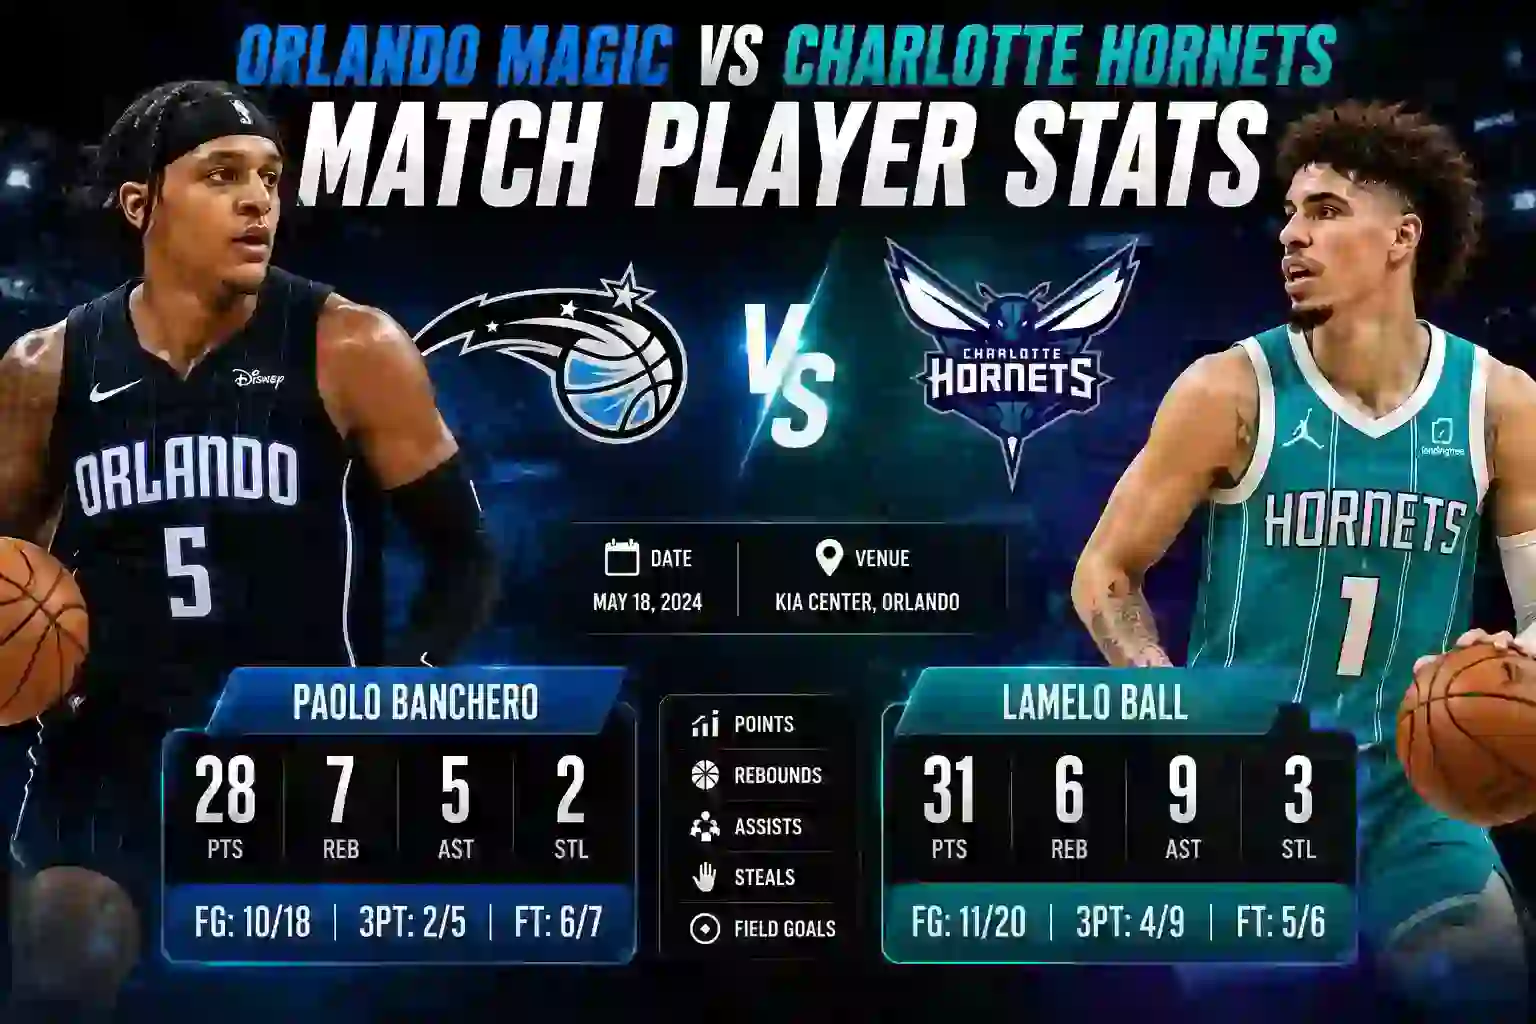
Orlando’s balance was the story of the night. Four different Magic starters scored in double figures, led by Paolo Banchero’s 25-point, 6-assist showing, while the Hornets leaned almost entirely on LaMelo Ball’s 23 points to stay competitive. Charlotte actually matched Orlando in the third and fourth quarters, but the 26-point halftime deficit was simply too much to overcome. Every core number in the Orlando Magic vs Charlotte Hornets match player stats sheet, from shooting efficiency to bench production, favored the home team.
Match Overview Table
| Information | Match Details |
| Event | NBA Play-In Tournament — No. 8 Seed Game |
| Game | Charlotte Hornets @ Orlando Magic |
| Date | Friday, April 17, 2026 |
| Venue | Kia Center, Orlando, Florida |
| Attendance | Sellout crowd at Kia Center |
| Winner | Orlando Magic |
| Final Score | Magic 121, Hornets 90 |
| Broadcast | Regional sports networks (FanDuel Sports Network Florida / Bally Sports South) |
Core Match Statistics Overview
Team Stats Table
| Metric | Orlando Magic | Charlotte Hornets |
| Field Goal % | 50.0% (42-84) | 33.7% (28-83) |
| 3-Point % | 29.6% (8-27) | 26.7% (12-45) |
| Free Throw % | 78.4% (29-37) | 88.0% (22-25) |
| Total Rebounds | 58 | 52 |
| Assists | 27 | 17 |
| Turnovers | 14 | 20 |
| Steals | 6 | 7 |
| Blocks | 8 | 4 |
| Bench Points | 37 | 25 |
| Points in the Paint | 64 | 28 |
Two-Point Efficiency
- Orlando shot a scorching 59.6% on twos, feasting at the rim with a 77.4% clip on shots at the basket.
- Charlotte managed just 42.1% on twos and only 62.5% at the rim, a gap that explains most of the scoring margin.
Three Point Shooting
- The Hornets actually attempted 18 more threes (45 to 27) but connected on a lower percentage than Orlando, a classic case of quantity without quality.
- Orlando’s more selective long-range approach still supplied enough spacing, with Paolo Banchero and Jalen Suggs combining to hit 4-of-11 from deep.
Ball Movement
- Orlando’s 27 assists against just 14 turnovers produced a healthy 1.93 assist-to-turnover ratio, a number that speaks to disciplined half-court execution.
- Charlotte finished with an assist-to-turnover ratio of only 0.85, as 20 giveaways repeatedly interrupted any offensive rhythm.
Rebounding and Second-Chance Opportunities
- Overall, Orlando outrebounded Charlotte 58–52, but defensive rebounding was the decisive factor. The Magic held the Hornets to only 7 offensive rebounds early in the game before Charlotte’s bench crashed the glass late.
- Orlando’s 19 second-chance points nearly doubled Charlotte’s 11, punishing the Hornets for every extra possession they surrendered on the offensive glass.
Period-by-Period Analysis
First Quarter
| Team | Q1 Score |
| Orlando Magic | 38 |
| Charlotte Hornets | 16 |
- Orlando opened the game shooting the ball at an elite clip, using fast-break points and paint touches to build an early cushion.
- Charlotte’s offense stalled almost immediately, missing open perimeter looks that would haunt the team all night.
- By the end of the frame, Orlando had already built the kind of lead that changes a coach’s rotation plan.
Second Quarter
| Team | Q2 Score |
| Orlando Magic | 30 |
| Charlotte Hornets | 21 |
- Franz Wagner and Wendell Carter Jr. kept piling on points in the paint, pushing the halftime margin to 26.
- Charlotte tightened its defense slightly but still couldn’t find enough stops to change the game’s trajectory.
- The Hornets’ bench got minutes early, a signal the starting lineup wasn’t solving Orlando’s pace.
Third Quarter
| Team | Q3 Score |
| Orlando Magic | 34 |
| Charlotte Hornets | 34 |
- Charlotte finally matched Orlando’s output for a full quarter, with LaMelo Ball attacking downhill more aggressively.
- Orlando’s starters eased off the gas slightly, content to protect the lead rather than extend it further.
- Even quarter play here still left Charlotte facing an enormous deficit heading into the fourth.
Fourth Quarter
| Team | Q4 Score |
| Orlando Magic | 19 |
| Charlotte Hornets | 19 |
- Both benches saw extended run once the outcome was decided, with Orlando’s reserves outscoring Charlotte’s bench for the game overall.
- Charlotte’s young rotation pieces got valuable playoff-atmosphere reps despite the lopsided score.
- Orlando closed out the win comfortably, never allowing Charlotte’s garbage-time run to threaten the final margin.
Detailed Team Player Statistics
Orlando Magic Player Statistics
| Player | Points | Rebounds | Assists | Steals | Blocks |
| Paolo Banchero | 25 | 5 | 6 | 2 | 1 |
| Franz Wagner | 18 | 7 | 6 | 1 | 0 |
| Wendell Carter Jr. | 16 | 6 | 1 | 0 | 1 |
| Jalen Suggs | 12 | 5 | 6 | 0 | 1 |
Paolo Banchero was the most efficient high-volume scorer on the floor, hitting 9-of-17 shots while also setting up teammates six times. Franz Wagner nearly matched him with an 18-point, 7-rebound, 6-assist all-around effort that stretched the Hornets defense in every direction.
Wendell Carter Jr. was surgical inside, going 6-of-7 from the field including a perfect 2-of-2 from three, giving Orlando unexpected floor spacing from the center position. Jalen Suggs controlled tempo with six assists and knocked down two triples, giving the Magic a fourth double-figure scorer to spread out Charlotte’s defensive attention.
Charlotte Hornets Player Statistics
| Player | Points | Rebounds | Assists | Steals | Blocks |
| LaMelo Ball | 23 | 2 | 5 | 0 | 0 |
| Miles Bridges | 15 | 2 | 1 | 0 | 0 |
| Brandon Miller | 14 | 3 | 1 | 2 | 0 |
| Moussa Diabate | 2 | 8 | 2 | 0 | 3 |
LaMelo Ball carried the offensive workload almost single-handedly, scoring 23 points on 7-of-17 shooting while also getting to the free-throw line six times. Miles Bridges added 15 points but needed 12 shots to get there, and his minus-29 plus-minus reflected how little the supporting cast contributed around him.
Brandon Miller shot an efficient 5-of-10 for 14 points but was also careless with the ball, turning it over five times. Moussa Diabate anchored the interior defensively with a team-high 8 rebounds and 3 blocks, though his offensive impact stayed minimal at just 2 points.
Statistical Leaders Summary Table
| Category | Orlando Magic | Charlotte Hornets |
| Leading Scorer | Paolo Banchero (25 pts) | LaMelo Ball (23 pts) |
| Second Leading Scorer | Franz Wagner (18 pts) | Miles Bridges (15 pts) |
| Top Rebounder | Franz Wagner (7 reb) | Moussa Diabate (8 reb) |
| Most Assists/Playmaker | Franz Wagner / Paolo Banchero (6 ast) | LaMelo Ball (5 ast) |
Analytical Breakdowns
Why the Magic Won
Balanced Offensive Production
| Stat | Orlando Magic | Charlotte Hornets |
| Players in Double Figures | 5 | 3 |
| Bench Points | 37 | 25 |
| Points in Paint | 64 | 28 |
Orlando got scoring from five different players, which meant Charlotte’s defense never had a single matchup to key on. On the bench, Orlando’s reserves outscored Charlotte’s by 12 points, demonstrating that balance as well.
Elite Interior Shot Selection
Orlando shot 77.4% at the rim compared to Charlotte’s 62.5%, and the Magic simply hunted better shots all night. A 64-28 advantage in points in the paint is the single clearest number in the entire Orlando Magic vs Charlotte Hornets match player stats sheet.
Turnover Discipline
Orlando’s 27 assists against 14 turnovers stands in sharp contrast to Charlotte’s 17 assists and 20 turnovers. Every extra Hornets turnover became a fast-break opportunity, and Orlando cashed in with 24 fast-break points on the night.
Defensive Activity
Eight Orlando blocks, including four from Goga Bitadze off the bench, discouraged Charlotte from attacking the rim as the game wore on, pushing the Hornets toward a heavier and less efficient jump-shooting diet.
Why the Hornets Lost
Heavy Dependence on Two Players
LaMelo Ball and Miles Bridges combined for 38 of Charlotte’s 90 points, but no other Hornet reached 15. When Orlando’s defense made those two work for their shots, the rest of the roster couldn’t pick up the slack.
Live-Ball Turnovers
Twenty total turnovers, many of them live-ball giveaways, handed Orlando 26 points off turnovers. That number alone nearly matched Charlotte’s entire fourth-quarter output for the game.
Cold Perimeter Shooting Early
Charlotte’s 26.7% mark from three, built on a high-volume 45 attempts, meant the Hornets kept firing without ever finding a rhythm, and the misses fueled Orlando’s transition attack in the first half.
Historical Context & Advanced Insights
Season Series Breakdown
| Matchup Date | Result |
| October 31, 2025 | Hornets won 120-105 |
| December 27, 2025 | Hornets won 124-97 |
| March 19, 2026 | Hornets won 130-111 |
| April 17, 2026 (Play-In) | Magic won 121-90 |
Charlotte actually won three of the first four meetings between these two teams during the 2025-26 campaign, making this play-in result a significant reversal at the one point that mattered most for playoff positioning.
Advanced Statistical Insights
The assist-to-field-goal ratio tells the real story of Orlando’s offensive execution: 27 assists on 42 made field goals means roughly 64% of Orlando’s baskets came directly off a pass, a sign of genuine ball movement rather than isolation scoring. Charlotte’s 17 assists on 28 makes translates to about 61%, a respectable number on paper, but it was undercut by the sheer volume of empty possessions from 20 turnovers. Orlando’s offensive rating of 117.2 points per 100 possessions dwarfed Charlotte’s 84.1, while the effective field goal percentage split (54.8% to 41.0%) shows how much value Orlando extracted from every possession compared to its opponent.
Game Implications & Key Lessons
What This Means for the Magic
- Orlando carries momentum and a full head of confidence into the first round of the playoffs.
- The balanced scoring from Banchero, Wagner, Carter Jr., and Suggs gives the coaching staff multiple offensive options against tougher postseason defenses.
- The Magic proved their interior defense, anchored by shot-blocking from the frontcourt, can slow down a team built around perimeter shot volume.
What This Means for the Hornets
- Charlotte’s season ends with the front office needing to address depth beyond its top two or three scorers.
- Turnover issues that surfaced in this elimination game reflect a pattern that needs correcting for future high-stakes moments.
- The Hornets’ three-point volume without accuracy suggests better shot selection will be a priority heading into next season.
Key Lessons
- Efficient shot selection inside the arc consistently beats high-volume, low-percentage three-point shooting.
- Ball movement and a strong assist-to-turnover ratio create sustainable offense in big games.
- Bench scoring depth can be the deciding factor when starters are otherwise evenly matched.
- Live-ball turnovers are especially costly because they fuel opponent transition offense.
- Rim protection changes an opponent’s shot diet and can swing a game’s entire tempo.
- Balanced scoring across four or five players is harder for a defense to game-plan against than reliance on one or two stars.
Frequently Asked Questions
Who won the Orlando Magic vs Charlotte Hornets game?
The Orlando Magic won 121-90, clinching a playoff berth in the NBA Play-In Tournament.
Who finished the game with the most points?
LaMelo Ball led Charlotte with 23 points, while Paolo Banchero led all scorers for Orlando with 25 points.
What were Paolo Banchero’s stats in the game?
Banchero finished with 25 points on 9-of-17 shooting, 5 rebounds, 6 assists, and 2 steals.
How many Orlando players scored in double figures?
Five Magic players reached double figures: Paolo Banchero, Franz Wagner, Wendell Carter Jr., Jalen Suggs, and Desmond Bane.
What was the biggest factor in Orlando’s win?
Interior efficiency and ball movement stood out most, with Orlando shooting 77.4% at the rim and posting a 1.93 assist-to-turnover ratio compared to Charlotte’s 0.85.
Where was the game played?
The game was played at Kia Center in Orlando, Florida, as the No. 8 seed play-in game.
Conclusion
The Orlando Magic vs Charlotte Hornets match player stats make clear that this wasn’t a game decided by one hot shooting stretch or a single star performance. It was decided by balance, ball security, and interior efficiency stacked over 48 minutes. Orlando got scoring from five different players, protected the basketball, and controlled the paint from the opening tip, while Charlotte leaned too heavily on LaMelo Ball and Miles Bridges without enough support to survive an elimination game. Teamwork and efficient shot selection outperformed individual brilliance, and that gap is exactly why the Magic are moving on to the playoffs while the Hornets’ season has come to an end.