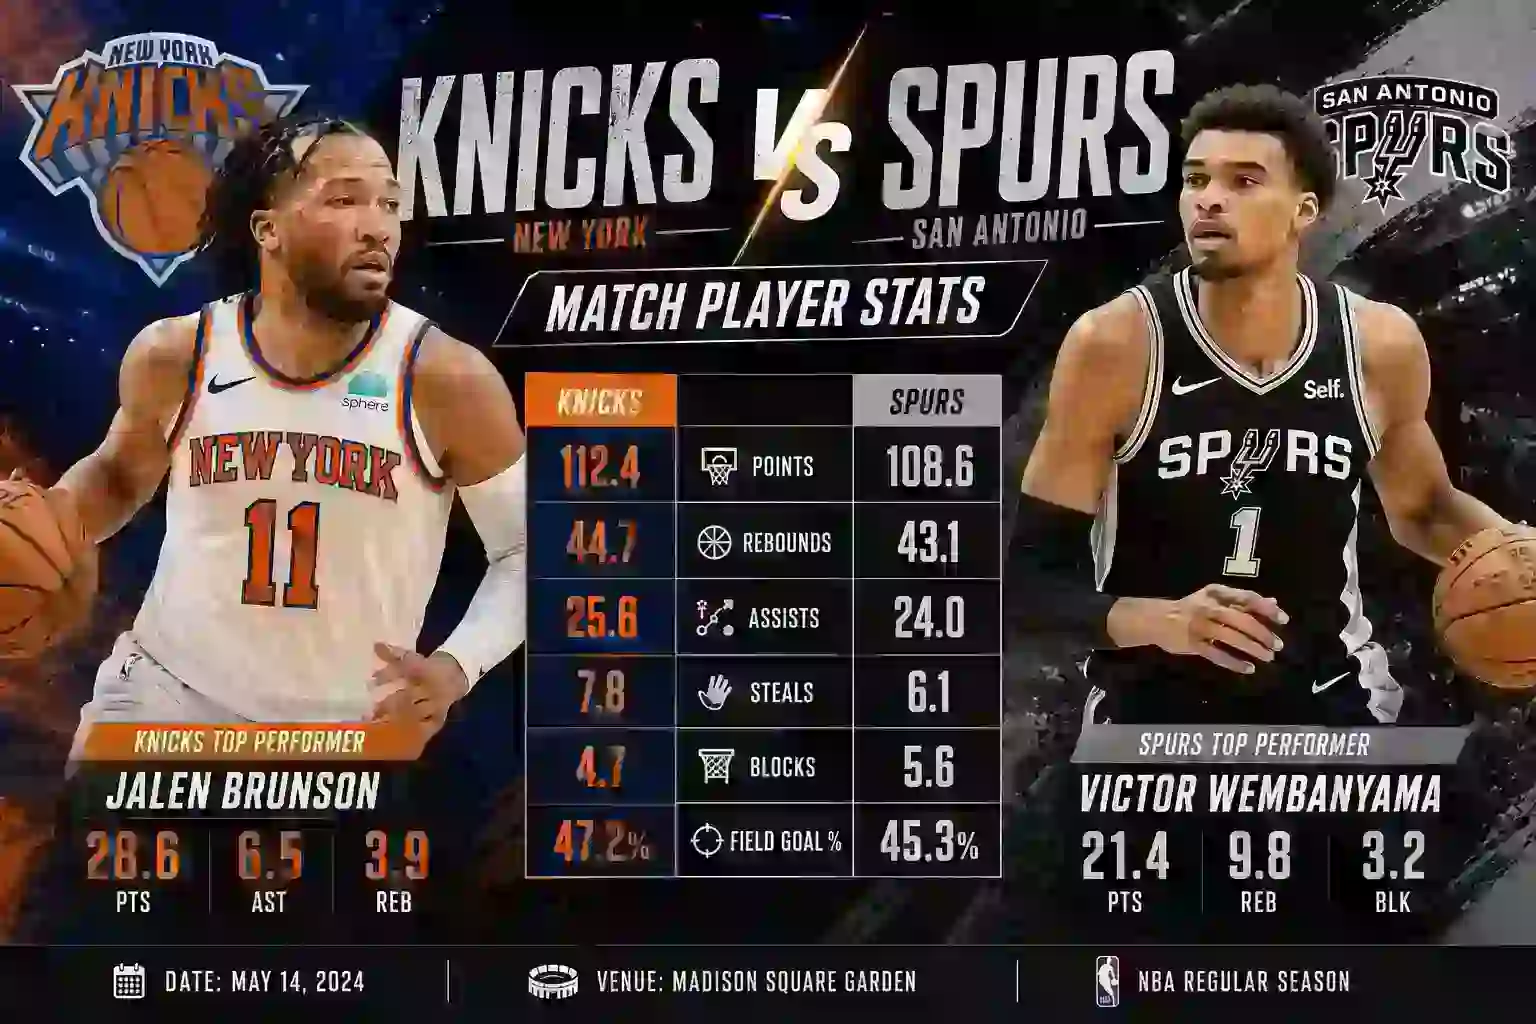
Knicks vs San Antonio Spurs Match Player Stats: Jalen Brunson’s 45 Points Lead
Championship basketball comes down to who makes plays when legs are heavy and the margin is thin. That’s exactly what happened in Game 5, and anyone searching for Knicks vs San Antonio Spurs match player stats wants the full breakdown of how it happened, not just the final score. Below is every number that mattered, from the box score to the shot zones that decided a title.
The Lead
The New York Knicks closed out the 2026 NBA Finals on the road, beating the San Antonio Spurs 94-90 in Game 5 to win the series 4-1. Played in front of a sold-out crowd at Frost Bank Center in San Antonio, the game stayed within single digits for nearly the entire second half, with New York finally pulling away behind a 29-point fourth quarter that neutralized every push the Spurs attempted.
Jalen Brunson was the story of the night, scoring a game-high 45 points on 14-of-27 shooting while getting to the free-throw line 15 times. San Antonio got a strong two-way effort from Victor Wembanyama, who posted a 19-point, 14-rebound double-double, and Dylan Harper added 25 points off pure shot-making, but the Spurs bench and role players never found consistent offense outside the two-man punch. New York’s defense forced a rough shooting night from De’Aaron Fox (3-of-15) and Stephon Castle (1-of-10), and that was the difference in a game decided by single-digit possessions down the stretch.
Match Overview Table
| Information | Match Details |
| Event | NBA Finals, Game 5 |
| Game | New York Knicks vs San Antonio Spurs |
| Date | Saturday, June 13, 2026 |
| Venue | Frost Bank Center, San Antonio, TX |
| Attendance | Sold out (approx. 18,231) |
| Winner | New York Knicks (series clinched, 4-1) |
| Final Score | Knicks 94, Spurs 90 |
| Broadcast | ABC / ESPN national broadcast |
Core Match Statistics Overview
The New York Knicks vs San Antonio Spurs box score shows a game that was close on paper but decisively won at the free-throw line and on the defensive glass.
| Team Stat | San Antonio Spurs | New York Knicks |
| Field Goal % | 38.4% (33-86) | 35.6% (31-87) |
| 3-Point % | 32.4% (12-37) | 32.4% (12-37) |
| Free Throw % | 63.2% (12-19) | 71.4% (20-28) |
| Total Rebounds | 59 | 66 |
| Offensive Rebounds | 14 | 13 |
| Assists | 18 | 14 |
| Turnovers | 13 | 14 |
| Steals | 6 | 8 |
| Blocks | 7 | 4 |
| Points in the Paint | 38 | 30 |
| Bench Points | 32 | 9 |
Free Throw Discipline
- New York attempted 28 free throws to San Antonio’s 19, a nine-attempt edge that came almost entirely from Brunson’s relentless drives.
- The Knicks converted at 71.4% from the line compared to the Spurs’ 63.2%, turning aggression into eight extra points on the night.
Points in the Paint
- San Antonio out-scored New York in the paint 38-30, largely on the strength of Wembanyama’s interior touches and Harper’s downhill drives.
- Despite the paint deficit, New York’s defensive rebounding limited second-chance opportunities enough to offset the gap elsewhere on the floor.
Bench Production Gap
- San Antonio’s reserves outscored New York’s bench 32-9, the single widest statistical gap of the game.
- That bench cushion kept the Spurs within range in the third quarter, but it wasn’t enough once the Knicks starters took over in the fourth.
Rebounding Battle
- New York finished with a 66-59 rebounding advantage, anchored by Karl-Anthony Towns and Mitchell Robinson combining for 20 boards.
- San Antonio’s offensive rebounding rate stayed competitive at 14, largely due to Wembanyama’s six offensive boards alone.
Period-by-Period Analysis
First Quarter
| Period | Spurs | Knicks |
| Q1 | 23 | 13 |
- San Antonio came out hot from beyond the arc and built an early double-digit cushion.
- New York’s offense stalled with cold shooting from its starting backcourt outside of Brunson.
- The Spurs’ interior size bothered New York’s role players early, forcing tough looks near the rim.
Second Quarter
| Period | Spurs | Knicks |
| Q2 | 19 | 24 |
- New York out-scored San Antonio by five in the quarter, chipping the deficit down before halftime.
- Mikal Bridges and Josh Hart began knocking down open threes as San Antonio’s defense sagged toward Brunson.
- The Knicks’ bench provided a needed spark to keep the game from getting out of hand.
Third Quarter
| Period | Spurs | Knicks |
| Q3 | 30 | 28 |
- San Antonio’s biggest lead of the game, 16 points, came in this stretch as Harper and Champagnie caught fire.
- New York answered with a run fueled almost entirely by Brunson isolations and free-throw trips.
- Turnovers on both ends kept the pace fast, with the Spurs scoring 21 points off Knicks giveaways for the game.
Fourth Quarter
| Period | Spurs | Knicks |
| Q4 | 18 | 29 |
- New York out-scored San Antonio 29-18 in the fourth, the largest quarter differential of the entire game.
- Brunson took over in isolation, repeatedly drawing fouls and closing out possessions at the line.
- San Antonio’s offense went cold across the final minutes, unable to generate clean looks against New York’s set defense.
New York Knicks Player Statistics
| Player | PTS | REB | AST | STL | BLK | FG |
| Jalen Brunson | 45 | 3 | 3 | 2 | 0 | 14-27 |
| Josh Hart | 13 | 11 | 2 | 0 | 0 | 4-11 |
| Mikal Bridges | 14 | 2 | 4 | 0 | 1 | 5-10 |
| OG Anunoby | 11 | 8 | 0 | 3 | 1 | 3-11 |
| Mitchell Robinson | 2 | 10 | 2 | 0 | 0 | 1-2 |
| Karl-Anthony Towns | 2 | 10 | 1 | 3 | 1 | 1-7 |
Brunson delivered the signature performance of the series, carrying New York’s offense on nearly every possession down the stretch while shooting an efficient 51.9% from the field and a scorching 57.1% from three. Hart and Robinson both grabbed double-digit rebounds, giving New York the extra possessions it needed against a bigger San Antonio frontcourt.
Bridges provided secondary scoring punch with three triples, while Anunoby’s defensive activity, three steals and a block, disrupted San Antonio’s ball-handlers throughout the second half. Towns struggled shooting the ball (1-of-7) but still grabbed 10 rebounds and drew multiple fouls, doing enough work off the ball to stay useful on a rough shooting night.
San Antonio Spurs Player Statistics
| Player | PTS | REB | AST | STL | BLK | FG |
| Dylan Harper | 25 | 5 | 4 | 0 | 1 | 10-19 |
| Victor Wembanyama | 19 | 14 | 2 | 0 | 5 | 7-19 |
| Julian Champagnie | 14 | 7 | 1 | 1 | 0 | 5-9 |
| Devin Vassell | 12 | 7 | 2 | 2 | 1 | 5-8 |
| De’Aaron Fox | 7 | 0 | 5 | 2 | 0 | 3-15 |
| Keldon Johnson | 7 | 5 | 0 | 0 | 0 | 2-5 |
Harper was San Antonio’s most efficient scorer, hitting nearly 53% of his shots and adding four assists in a losing effort. Wembanyama controlled the interior defensively with five blocks and a team-high 14 rebounds, recording his second-straight Finals double-double, but his own shooting struggled against New York’s length in isolation.
Fox had one of his quietest scoring nights of the postseason, finishing 3-of-15 from the field, though he still managed five assists and two steals to keep San Antonio’s offense organized. Champagnie and Vassell gave the Spurs their most efficient bench-level shooting, combining to hit 10-of-17 from the field, but neither could match New York’s top-end production.
Statistical Leaders Summary Table
| Category | San Antonio Spurs | New York Knicks |
| Leading Scorer | Dylan Harper (25) | Jalen Brunson (45) |
| Second Leading Scorer | Victor Wembanyama (19) | Mikal Bridges (14) |
| Top Rebounder | Victor Wembanyama (14) | Josh Hart (11) |
| Most Assists/Playmaker | De’Aaron Fox (5) | Mikal Bridges (4) |
Why the Knicks Won
Elite Isolation Scoring From Brunson
New York rode a single engine to the title in Game 5. Brunson’s 45 points came on a true shooting percentage of 67%, an extraordinary mark given the shot volume and defensive attention he faced all night.
| Metric | Brunson (Game 5) |
| Points | 45 |
| FG% | 51.9% |
| 3PT% | 57.1% |
| FT% | 86.7% |
| True Shooting % | 67.0% |
Free Throw Advantage
- New York shot nine more free throws than San Antonio (28 vs. 19) and converted at a higher rate, turning aggression into a real scoring edge.
- Brunson alone attempted 15 free throws, more than San Antonio’s entire team production from beyond the arc combined in raw point value.
Defensive Rebounding Control
- New York out-rebounded San Antonio 66-59 overall, and specifically won the defensive glass 35-33 while limiting second-chance points to 14.
- Towns and Robinson combining for 20 total rebounds neutralized San Antonio’s size advantage in the frontcourt.
Fourth-Quarter Composure
- The Knicks closed the game on a 29-18 fourth-quarter run, scoring efficiently while forcing tough, contested looks from San Antonio’s stars.
- New York’s bench, while thin in scoring, avoided costly turnovers in crunch time that could have opened the door for a San Antonio comeback.
Why the Spurs Lost
Heavy Dependence on Two Players
Harper and Wembanyama combined for 44 of San Antonio’s 90 points, meaning the rest of the roster shot a combined 16-of-58 from the field outside of that duo, a rate that couldn’t keep pace with New York’s balanced attack.
Poor Guard Shooting Efficiency
- Fox and Castle combined to shoot 4-of-25 from the field, a brutal 16% clip from San Antonio’s backcourt that stalled multiple offensive possessions.
- Neither guard found a consistent rhythm against New York’s perimeter defense, particularly Anunoby and Bridges switching onto ball-handlers.
Interior Defense Breakdowns Late
- San Antonio allowed 29 fourth-quarter points, its worst defensive quarter of the game, as fatigue set in against New York’s series of Brunson isolations.
- The Spurs’ inability to generate stops down the stretch, despite forcing 14 Knicks turnovers overall, ultimately cost them the closeout chance at home.
Historical Context & Advanced Insights
Series Breakdown
| Game | Score | Winner |
| Game 1 (SAS) | Spurs 95, Knicks 105 | Knicks |
| Game 2 (SAS) | Spurs 104, Knicks 105 | Knicks |
| Game 3 (NYK) | Knicks 111, Spurs 115 | Spurs |
| Game 4 (NYK) | Knicks 107, Spurs 106 | Knicks |
| Game 5 (SAS) | Spurs 90, Knicks 94 | Knicks (Series 4-1) |
New York controlled the series almost from the opening tip, winning three of the first four games before closing it out on the road in Game 5. San Antonio’s lone win, Game 3 at Madison Square Garden, came in the only contest where the Spurs shot over 45% as a team.
Advanced Statistical Insights
The assist-to-turnover ratio told much of the story of Game 5. San Antonio actually posted a better team ratio at 1.38 compared to New York’s 1.00, reflecting more structured ball movement on the Spurs’ end. But New York’s offensive rating of 93.7 against San Antonio’s 96.4 masks a deeper truth: nearly half of the Knicks’ offense came from isolation possessions finishing at the free-throw line rather than through assisted field goals, a style that sacrifices ball movement metrics for pure closing reliability. San Antonio’s effective field goal percentage of 45.3% actually outpaced New York’s 42.5%, showing the Spurs shot the more efficient looks; the difference-maker was New York converting extra possessions through offensive rebounds and free throws that don’t show up in a standard shooting split.
Game Implications & Key Lessons
What This Means for the Knicks
- New York validated years of roster building around Brunson’s shot creation, capping the run with a championship-clinching road performance.
- The frontcourt rotation of Towns and Robinson proved it can control a series against elite size, even on nights when scoring dries up.
- Brunson’s Finals scoring surge sets him up as the clear centerpiece for next season’s title defense.
What This Means for the Spurs
- San Antonio’s two-star foundation of Wembanyama and Harper is proven at the highest level, but the supporting cast needs more consistent shooting depth.
- Guard play, particularly from Fox and Castle, needs to be more efficient in high-leverage Finals possessions going forward.
- The bench scoring advantage San Antonio held all series wasn’t enough without more from the starting five in clutch moments.
Key Lessons
- Elite isolation scoring can outweigh a wide edge in team assist numbers when the fourth quarter arrives.
- Free-throw discipline decides close playoff games as much as field-goal shooting does.
- Defensive rebounding remains one of the most reliable predictors of playoff success.
- A two-star core needs at least one more consistent scoring option to win on the road in a closeout game.
- Cold shooting nights from star guards can be masked by playmaking, but not by winning.
- Bench production matters in the regular season, but starters decide championships.
Frequently Asked Questions
Who won the Knicks vs Spurs Finals series?
The New York Knicks won the 2026 NBA Finals 4 games to 1, closing out the series with a 94-90 win in San Antonio.
Who scored the most points in Game 5?
Jalen Brunson led all scorers with 45 points on 14-of-27 shooting, including 4-of-7 from three-point range.
What were Victor Wembanyama’s stats in the closeout game?
Wembanyama finished with 19 points, 14 rebounds, five blocks, and two assists in the Game 5 loss.
How many free throws did the Knicks shoot compared to the Spurs?
New York attempted 28 free throws and made 20, while San Antonio attempted 19 and made 12.
Which Knicks player had a double-double in the closeout game?
Josh Hart recorded a double-double with 13 points and 11 rebounds, joining Mitchell Robinson and Karl-Anthony Towns, who each grabbed 10 boards.
What was the biggest statistical difference in the game?
Bench scoring was the widest gap, with San Antonio’s reserves outscoring New York’s bench 32-9, though New York’s starters, led by Brunson, more than made up the difference.
Conclusion
Efficiency at the free-throw line and discipline on the defensive glass carried New York past a talented but top-heavy San Antonio roster. Brunson’s 45-point closeout performance will headline the story, but it was the Knicks’ collective rebounding and fourth-quarter poise that turned a back-and-forth road game into a championship. San Antonio’s two young stars showed they belong on this stage, and the pieces are there for a return trip, but this year, teamwork at the margins beat individual firepower at the center.