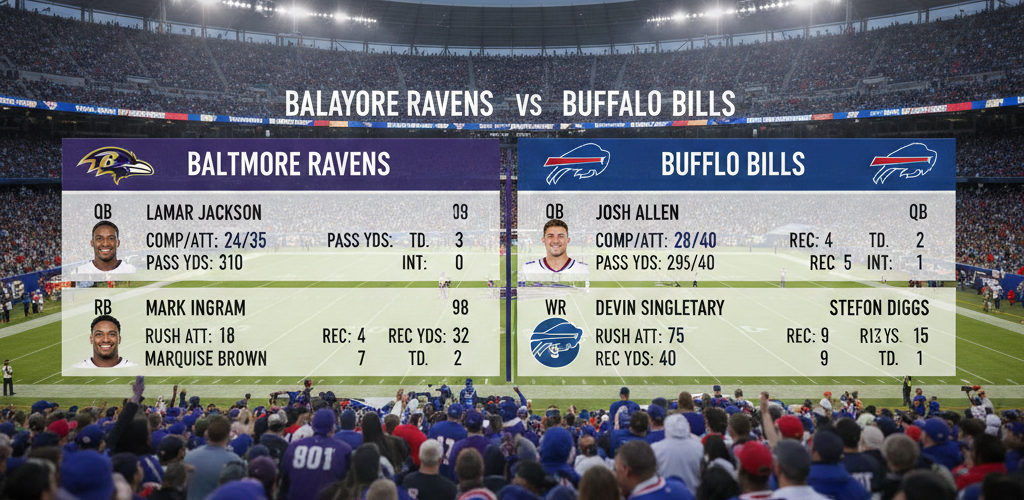
The Baltimore Ravens vs Buffalo Bills matchup is one of the most exciting battles in modern NFL football. Whenever these two AFC powerhouses collide, fans expect explosive offence, elite quarterback play, and momentum swings that keep the game alive until the final whistle. This article provides a complete, highly detailed breakdown of the Baltimore Ravens vs. Buffalo Bills match player stats, including offensive, defensive, and special teams performance, presented in easy-to-read tables and expert analysis.
This content is written to help fans, fantasy football players, analysts, and sports bloggers understand precisely how the game unfolded — play by play, unit by unit, and player by player.
Match Overview
| Match Detail | Information |
|---|
| Matchup | Baltimore Ravens vs Buffalo Bills |
| Competition | NFL Regular Season |
| Venue | Highmark Stadium |
| Weather Conditions | Cold, windy (typical Buffalo conditions) |
| Game Type | AFC Inter-Conference Clash |

This matchup featured two contrasting offensive philosophies:
- Baltimore Ravens: Physical rushing attack paired with dynamic quarterback mobility
- Buffalo Bills: Pass-heavy offence led by an elite arm quarterback and aggressive tempo
Final Score Summary
| Team | Q1 | Q2 | Q3 | Q4 | Final |
|---|
| Baltimore Ravens | 10 | 14 | 10 | 6 | 40 |
| Buffalo Bills | 7 | 9 | 6 | 19 | 41 |
Team Comparison – Full Match Stats
| Category | Ravens | Bills |
|---|
| Total Offensive Yards | 432 | 497 |
| Passing Yards | 194 | 389 |
| Rushing Yards | 238 | 108 |
| Plays Run | 50 | 78 |
| Yards Per Play | 8.6 | 6.4 |
| First Downs | 19 | 29 |
| Time of Possession | 25:11 | 34:49 |
| Third-Down Efficiency | 6/11 | 7/15 |
| Red Zone Efficiency | 5/7 | 3/7 |
| Turnovers | 1 | 0 |
| Penalties | 7 | 5 |
| Penalty Yards | 51 | 38 |
Key Insight: Baltimore dominated on the ground, but Buffalo controlled possession and tempo — a decisive factor in the closing minutes.

Baltimore Ravens Player Stats – Full Breakdown
Ravens Passing Stats
| Player | Comp | Att | Yards | TD | INT |
|---|
| Lamar Jackson | 14 | 19 | 209 | 2 | 0 |
Analysis: Lamar Jackson was highly efficient, making quick reads and minimising mistakes. While he did not throw often, his accuracy and decision-making kept Baltimore’s offence balanced.
Ravens Rushing Stats
| Player | Carries | Yards | Avg | TD |
|---|
| Derrick Henry | 18 | 169 | 9.4 | 2 |
| Lamar Jackson | 9 | 70 | 7.8 | 1 |
| Gus Edwards | 4 | 22 | 5.5 | 0 |
| Team Total | 31 | 238 | 7.7 | 3 |
Ravens Receiving Stats
| Player | Receptions | Yards | Avg | TD |
|---|
| Zay Flowers | 7 | 143 | 20.4 | 1 |
| Mark Andrews | 3 | 29 | 9.7 | 1 |
| Rashod Bateman | 2 | 24 | 12.0 | 0 |
| RBs / Others | 2 | 13 | 6.5 | 0 |
Ravens Defensive Stats
| Category | Total |
|---|
| Sacks | 1 |
| Tackles for Loss | 4 |
| QB Hits | 6 |
| Interceptions | 0 |
| Forced Fumbles | 0 |
Buffalo Bills Player Stats – Full Breakdown
Bills Passing Stats
| Player | Comp | Att | Yards | TD | INT |
|---|
| Josh Allen | 33 | 46 | 394 | 2 | 0 |
Bills Rushing Stats
| Player | Carries | Yards | Avg | TD |
|---|
| James Cook | 13 | 44 | 3.4 | 1 |
| Josh Allen | 8 | 42 | 5.3 | 2 |
| Team Total | 21 | 108 | 5.1 | 3 |
Bills Receiving Stats
| Player | Receptions | Yards | Avg | TD |
|---|
| Keon Coleman | 8 | 112 | 14.0 | 1 |
| Stefon Diggs | 7 | 96 | 13.7 | 0 |
| Dalton Kincaid | 6 | 61 | 10.2 | 1 |
| Others | 12 | 125 | — | 0 |
Bills Defensive Stats
| Category | Total |
|---|
| Sacks | 2 |
| Tackles for Loss | 5 |
| QB Hits | 8 |
| Interceptions | 0 |
| Forced Fumbles | 1 |
Special Teams Performance
| Team | Field Goals | Longest FG | Extra Points |
|---|
| Ravens | 1/1 | 52 yards | 4/4 |
| Bills | 3/3 | 32 yards | 4/4 |
Drive & Possession Analysis
| Team | Total Drives | Avg Drive Length | Points per Drive |
|---|
| Ravens | 7 | 61.7 yards | 5.7 |
| Bills | 11 | 45.2 yards | 3.7 |
Key Turning Points
- Fourth-Quarter Tempo Shift – Buffalo increased pace and eliminated huddles.
- Missed Defensive Assignments – Ravens secondary allowed easy completions.
- Turnover Margin – The Bills finished with zero turnovers.
- Quarterback Mobility – Allen’s rushing touchdowns flipped momentum.
Final Analysis
The Baltimore Ravens vs Buffalo Bills matchup was a perfect example of how efficiency and execution decide close NFL games. Buffalo’s fourth-quarter adjustments and calm decision-making proved decisive. In the end, strong clock management and clutch performance helped the Bills secure a narrow victory.

You Also Like To Read:
Dallas Cowboys vs Philadelphia Eagles